



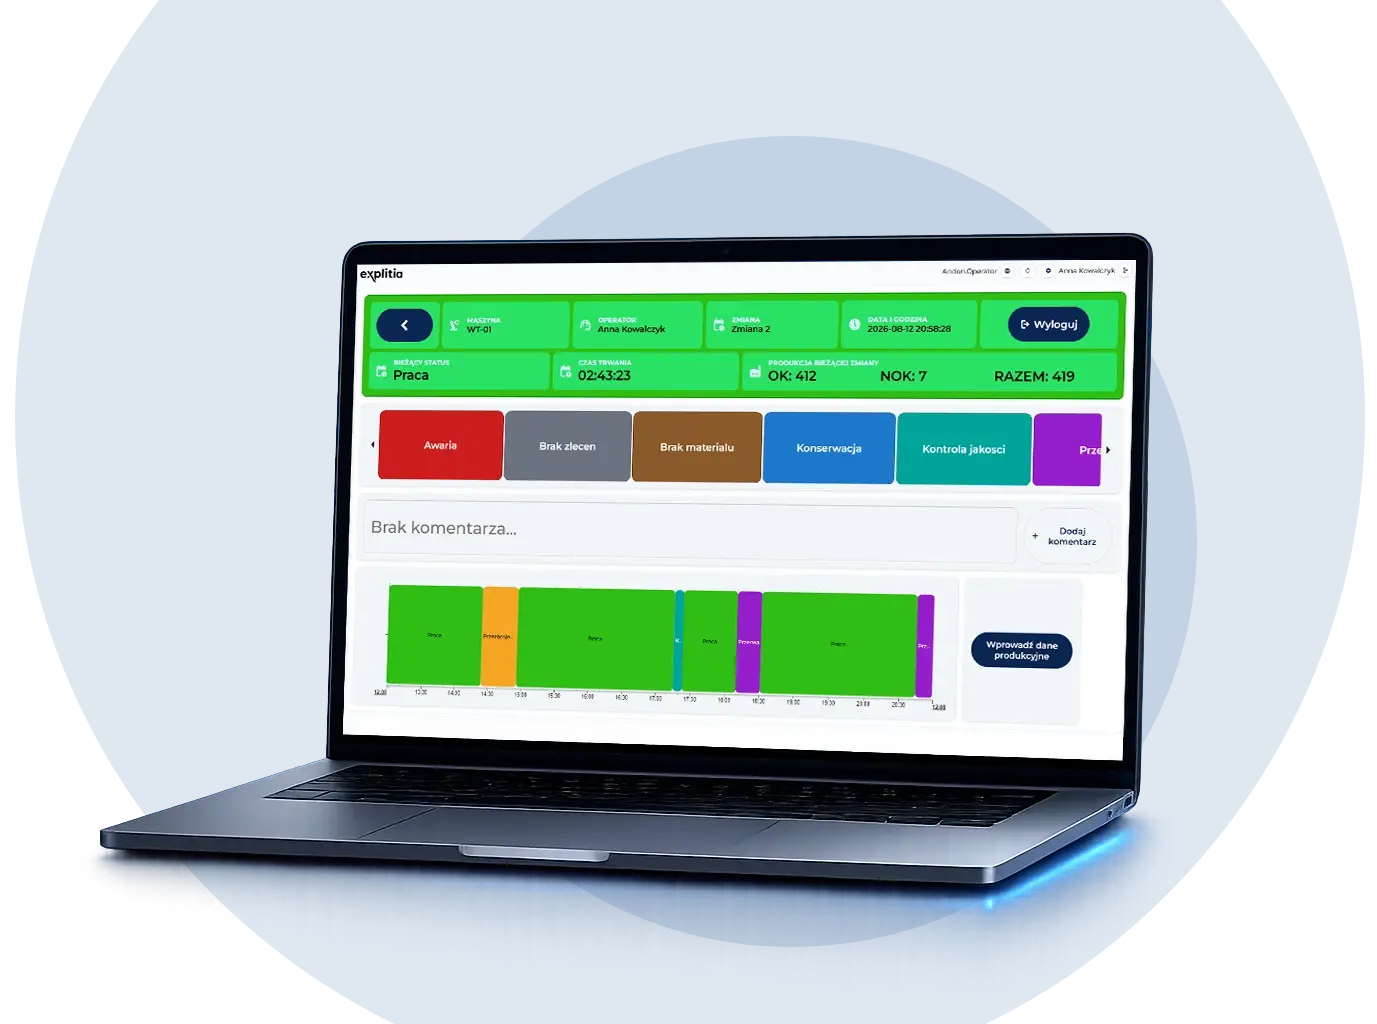

Real-time data collection
Collect electricity, gas and water consumption data automatically.

Energy consumption analysis
Analyse usage across machines, production lines and entire facilities.

Energy cost allocation
Convert utility consumption into production costs.

Loss identification
Detect anomalies and excessive consumption during downtime.
The effects of energy management systems
See how real-time energy monitoring helps reduce consumption, control costs and improve operational efficiency.


1. Data collection
The system collects data from electricity, gas and water meters, IoT sensors and production equipment.


2. Data organization
Energy data is assigned to specific machines, production lines and production areas.

3. Consumption analysis
The system shows current energy consumption and how it changes over time.

4. Converting consumption into costs
Consumption data can be calculated according to energy tariffs, enabling more accurate cost analysis.

5. Linking energy consumption to production
After integration with production systems, energy consumption can be assigned to a specific product, production order or process.

6. Anomaly identification
The system helps identify excessive consumption, energy losses and energy use during production downtime.

7. Visualization and reporting
Dashboards, charts and reports present consumption trends and key energy efficiency indicators.
8. Optimization
The collected data helps identify areas for improvement and monitor the effects of implemented optimization measures.


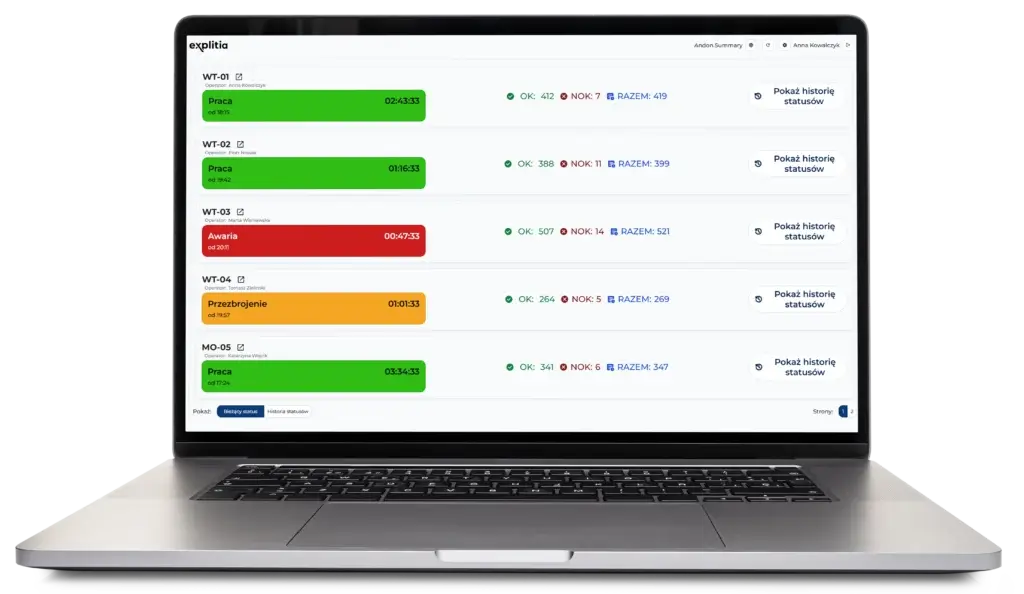
Data collection
Discover other modules of the Production Portal
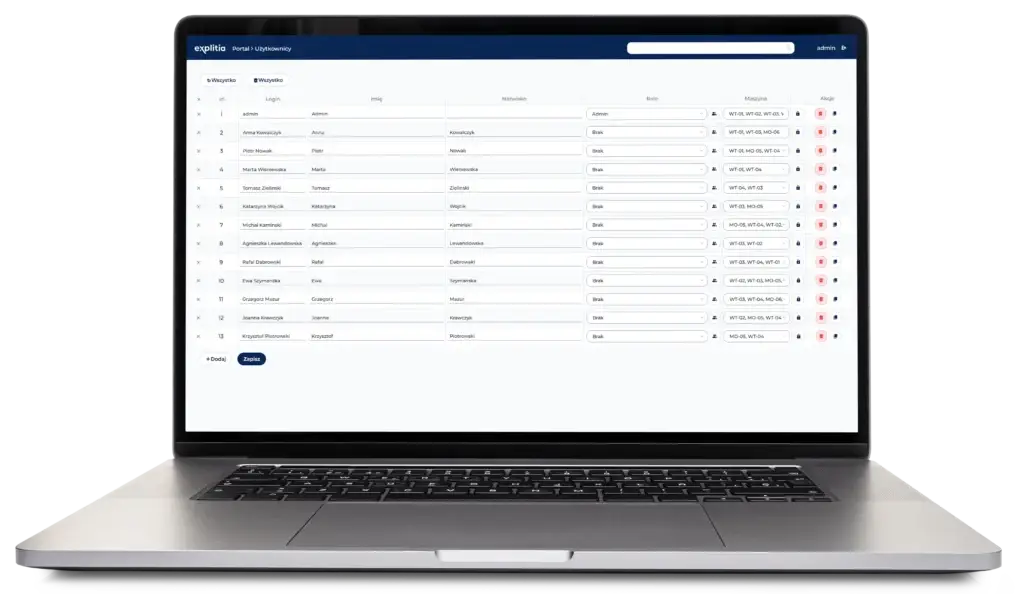
Energy dashboards
Discover other modules of the Production Portal
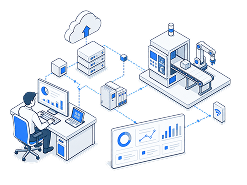
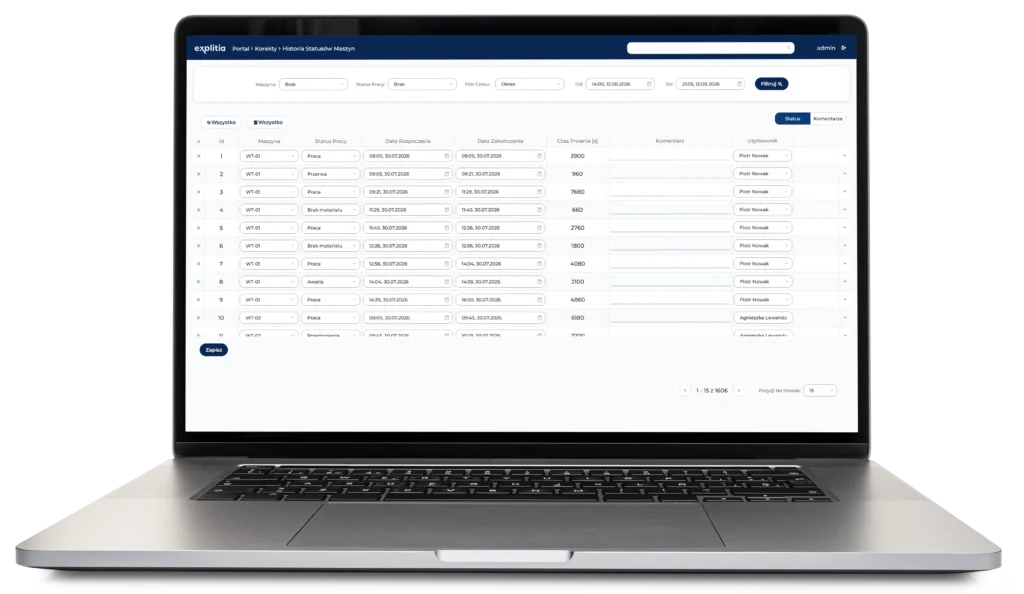
Cost allocation
Discover other modules of the Production Portal
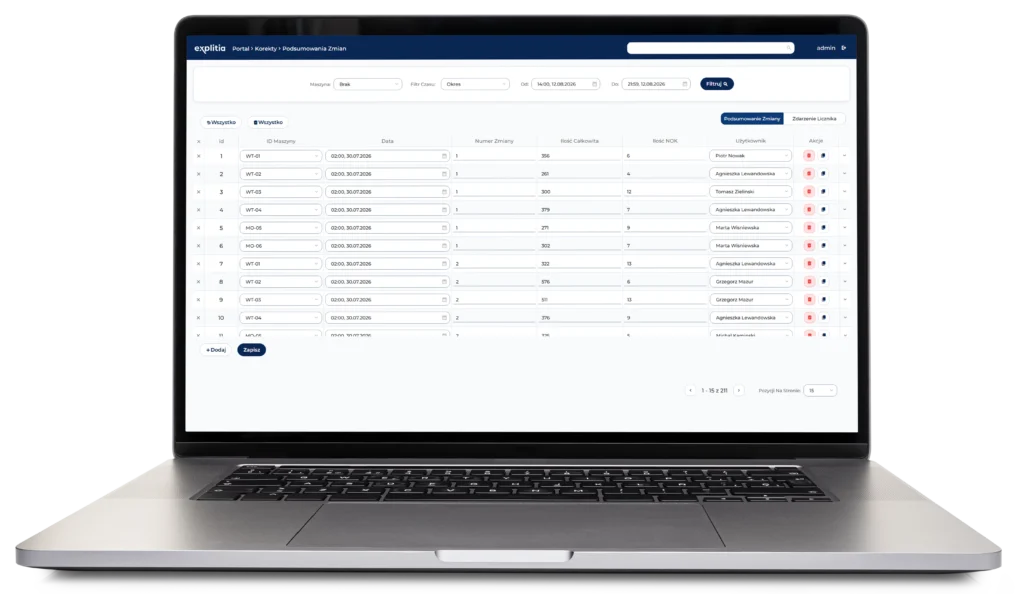
Loss analysis
Discover other modules of the Production Portal
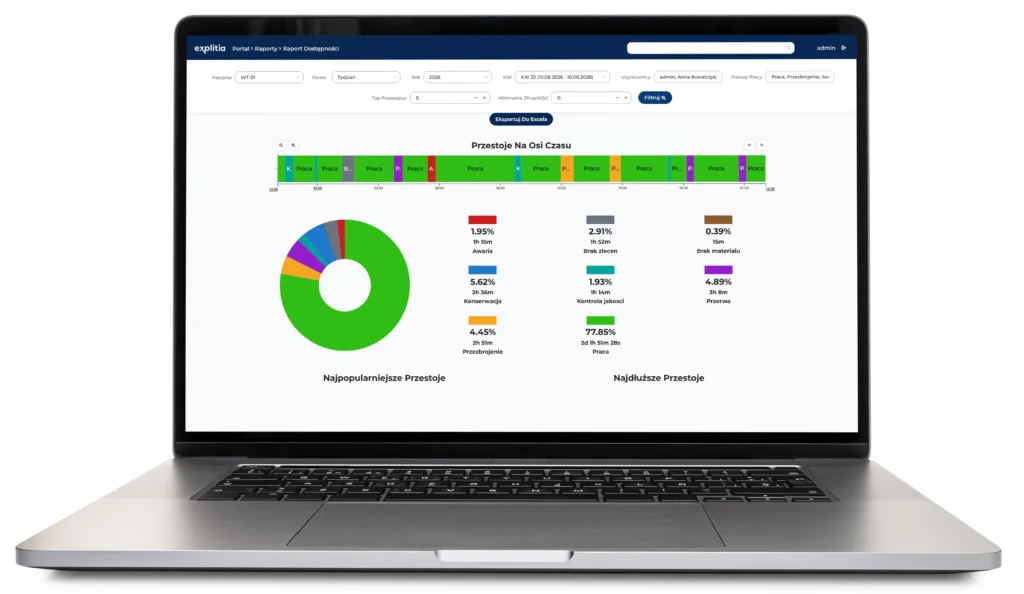
ESG reporting
Discover other modules of the Production Portal
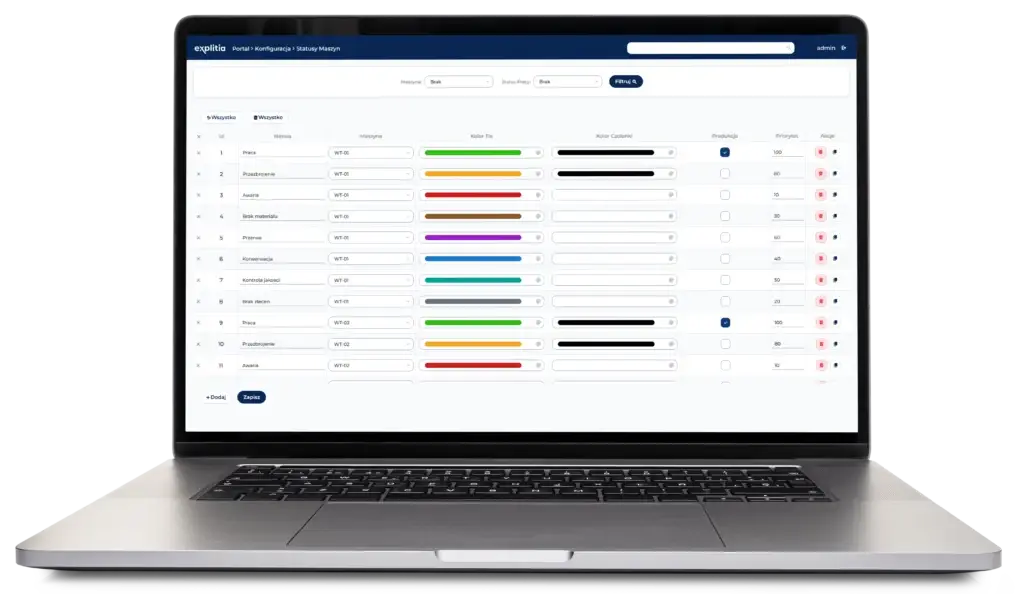
Production analysis
Discover other modules of the Production Portal






Start managing Energy efficiently
Monitor utility consumption, identify energy losses and improve production cost control with explitia.EMS.
Real-time utility data
Accurate energy costing
Automated reporting