


Statistical process control with explitia.SPC

Statistical process control with SPC

What is explitia.SPC?

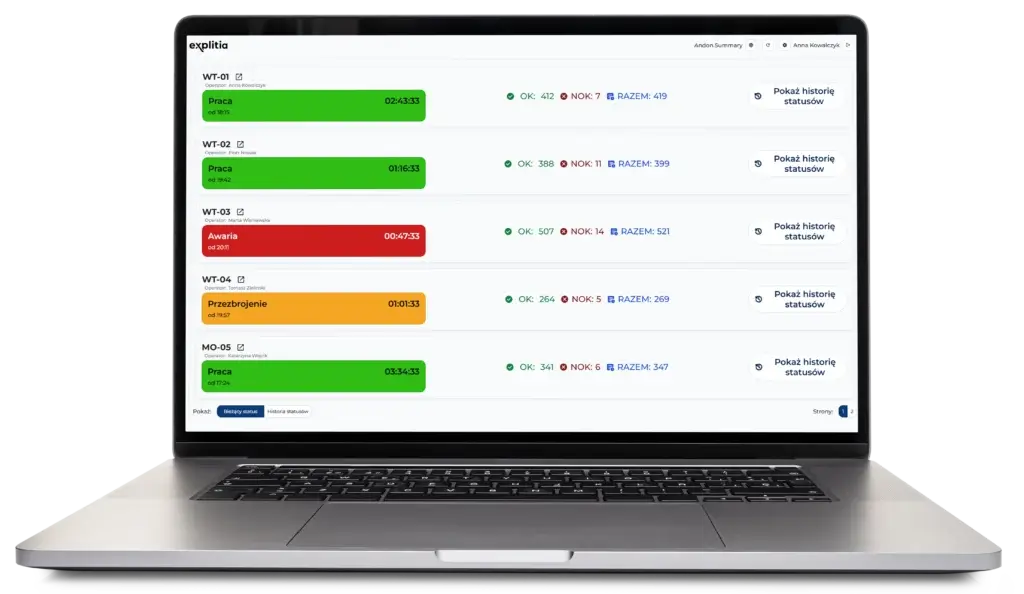
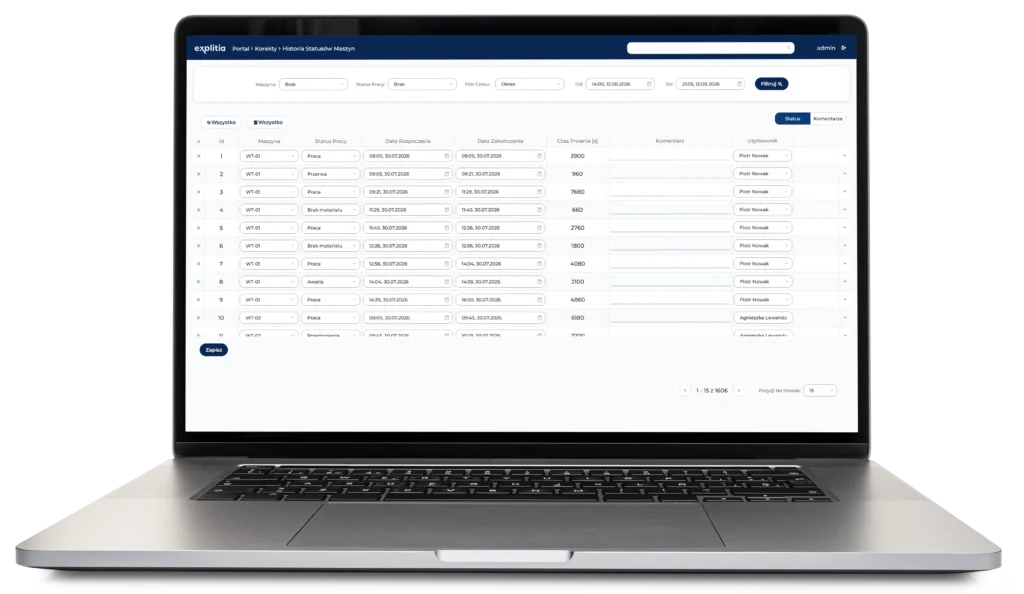
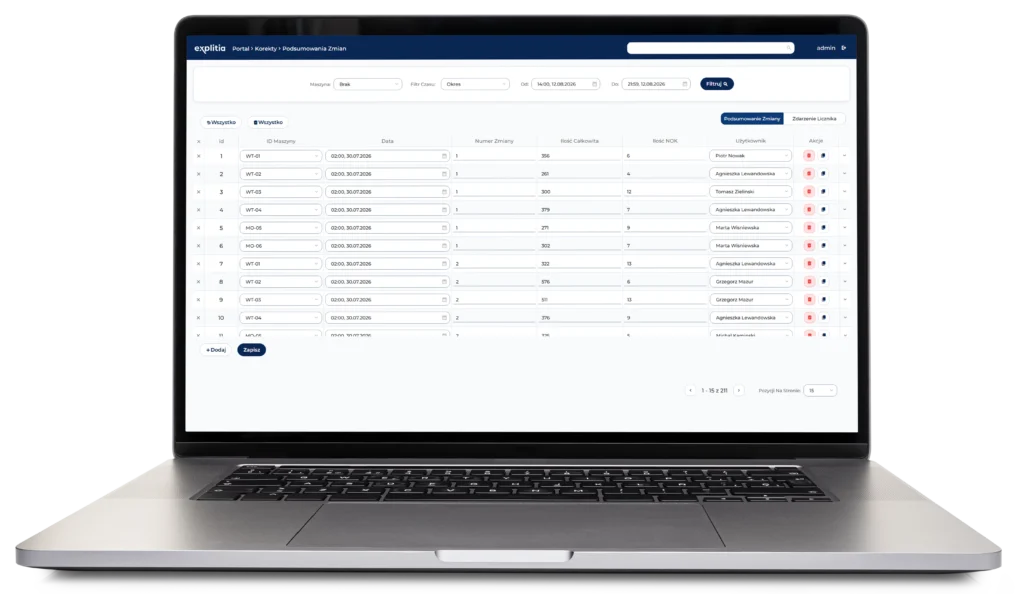
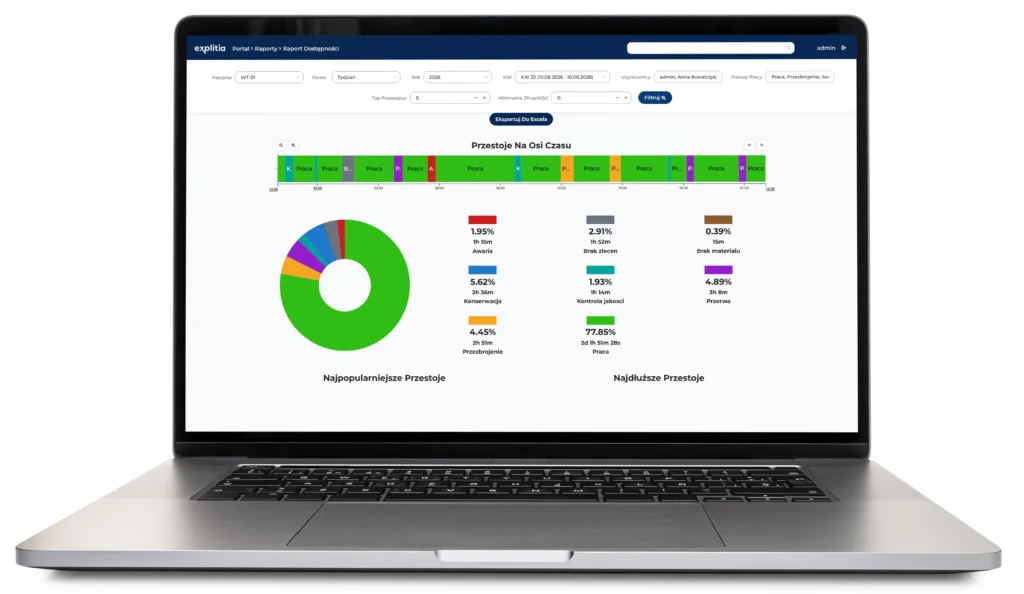
explitia.SPC is a statistical process control system that continuously analyses production data and detects abnormal process variation in real time.

Continuous process monitoring

Verify whether production parameters remain within expected limits.

Early deviation detection

Identify process instability before non-conforming products appear.

Real-time notifications

Inform production and quality teams when the process begins to change.

Multiple data sources

Analyse data from machines, databases, ERP, MES and Excel files.

The effects of statistical process control

explitia.SPC helps production, quality and maintenance teams respond while the process can still be corrected.

  • Key benefits for your production team

  • Monitor process stability continuously.

  • Receive alerts about abnormal variation.

  • Identify the causes of quality problems.

  • Connect quality control with maintenance.

  • Support quality audits with detailed reports.

React before a small disruption becomes a production loss

Faster problem detection

Correct deviations before defects appear.

Lower production costs

Reduce scrap, rework and unnecessary resource consumption.

Higher product quality

Maintain stable processes and consistent manufacturing conditions.

Data-driven decisions

Use reliable process and quality information.

How does explitia.SPC work?

Collect production data

The system receives measurements from machines, production lines, databases and external systems.

Define control parameters

Expected values, control limits and reaction rules are configured for the monitored process.

Analyse process variation

Statistical tools continuously verify whether the process remains stable.

Detect deviations

The system identifies abnormal patterns and alerts responsible teams.

Initiate corrective action

Notifications, workflows or machine-stop commands help prevent further quality losses.

What does explitia.SPC include?

Control charts

  • X-bar charts

  • R charts

  • Control limit monitoring

Integrations

The system can also integrate with CMMS software, allowing detected process instability to trigger a maintenance event and assign a task to the responsible technician.

How SPC improves production quality

Read the article

See how statistical process control helps detect deviations before they lead to defects.

  • Detect process instability

  • Reduce defects and rework

  • Improve quality control

explitia.SPC components

Cyber Resilience Act and MES, SCADA, and Industrial Machinery: Where Should You Start Your Assessment? (Photo of a manufacturing employee reviewing visualizations)

Process Stability Monitoring

Continuously verifies whether production parameters remain within expected control limits.

Statistical Analysis

Uses control charts, histograms and correlation diagrams to analyse process variation.

Root-Cause Analysis

Supports problem investigation with Pareto charts, Ishikawa diagrams and check sheets.

Notifications and Workflows

Alerts responsible teams and initiates corrective actions when deviations occur.

Reports and Quality Trends

Shows process stability, parameter changes and areas that require further investigation.

CMMS Integration

Transfers detected process problems directly to maintenance teams.

FAQ: Statistical Process Control

This field is required.

Scroll to Top
This site is registered on wpml.org as a development site. Switch to a production site key to remove this banner.